AI Search Visibility: How to Measure Mentions, Citations, Recommendations, and Source Share
Learn how to measure AI search visibility using brand mentions, recommendations, citations, source share, prompt coverage, and repeat consistency.
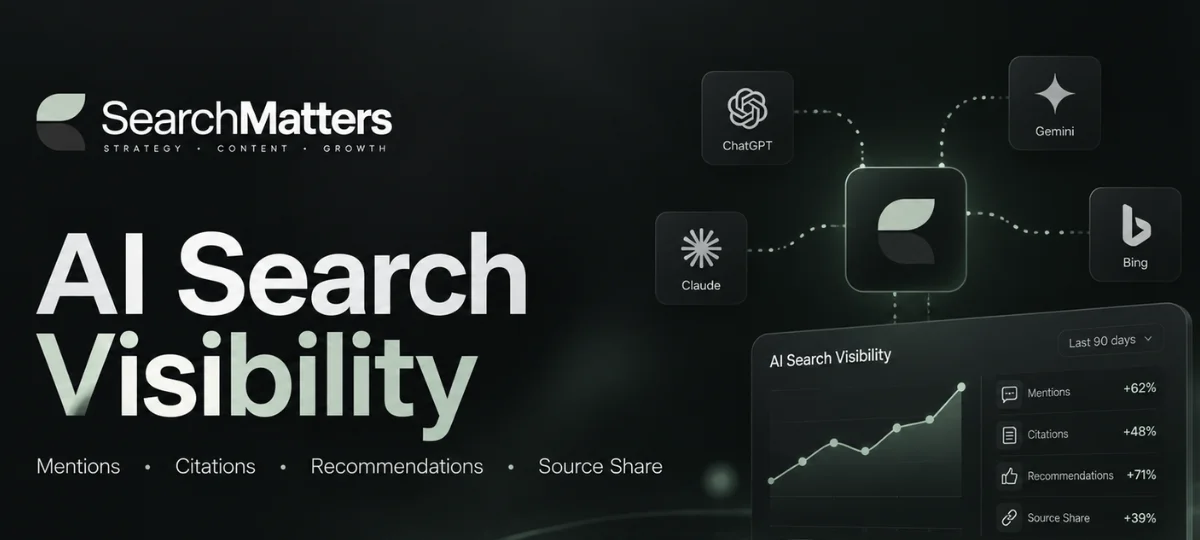
Key takeaways
- AI search visibility is not one metric. Brand mentions, recommendations, citations, prompt coverage, source share, and consistency tell you different things.
- Measure observations, not screenshots. I use one prompt × one AI engine × one run as one observation, then repeat important prompts to see whether the result holds.
- Track every AI engine separately. ChatGPT, Gemini, Google AI Mode, Perplexity, and other systems can surface very different brands and sources for similar questions.
- Look at who is supplying the information. Citation Rate and Source Share help show whether your own site, competitors, review platforms, publishers, or communities are influencing AI answers.
- Keep your prompt set clean. Separate branded from unbranded prompts, recommendation prompts from informational prompts, and benchmark prompts from exploratory research.
- Don’t stop at visibility. AI mentions and citations are discovery metrics. They still need to be connected with branded demand, traffic, leads, pipeline, and revenue where possible.
I’ve spent enough time looking at SEO reports to know how much easier things are when everybody agrees on what a metric actually means.
A ranking is a ranking.
An impression is an impression.
A click is a click.
AI search is nowhere near that clean yet.
When I started looking more seriously at visibility inside ChatGPT, Gemini, Google AI Mode, AI Overviews, Perplexity, Claude, and other AI search experiences, I kept running into the same problem.
People were using AI search visibility to describe completely different things.
Sometimes they meant the brand appeared somewhere in an answer.
Sometimes they meant the company was recommended.
Sometimes they meant the company’s website was cited.
Sometimes they meant the brand appeared more often than competitors.
Those are different events.
If I put all of them into one percentage, the report might look nice, but I lose most of the useful information.
For me, proper AI visibility tracking starts by separating what actually happened.
I want to know:
- Was the brand mentioned?
- Was it actually recommended?
- Was the company’s website cited?
- Which other websites were used as sources?
- How widely did the brand appear across the prompt set?
- Did the same result happen again when I repeated the prompt?
- Did it happen across several AI engines or only one?
That gives me something I can actually investigate.
Not another score.
What I mean by AI search visibility
When I use the term AI search visibility, I mean how often, where, and in what way a brand, product, or website appears when people ask relevant questions inside AI-powered search systems.
That can include ChatGPT, Gemini, Google AI Mode, Google AI Overviews, Perplexity, Claude, and similar experiences.
The important part for me is how the brand appears.
Let’s use a fictional project-management platform called Northstar.
An AI answer might say:
Popular project-management platforms include Northstar, Asana, Monday, and ClickUp.
Northstar was mentioned.
Another answer might say:
For a small agency that needs external client access, I would shortlist Northstar and Asana.
Northstar was recommended.
Another answer might explain how agencies manage client projects and use an article from northstar.com as one of its sources.
Now Northstar’s website has been cited.
All three create visibility.
But I wouldn’t report them as the same thing.
If I were working on Northstar’s SEO strategy, I would want to know which of those events is happening most often and where.
That is where the useful analysis begins.
Before measuring anything, define the observation
This is a small setup decision that can cause a big mess later.
Before calculating Mention Rate, Citation Rate, Recommendation Rate, or anything else, I want to define exactly what counts as one observation.
The definition I use is:
One prompt × one AI engine × one run = one observation
Suppose I am tracking 25 customer questions.
I test them in four AI engines.
I run each question four times.
That gives me:
25 × 4 × 4 = 400 observations
Those 400 observations become the base dataset.
I prefer doing it this way because one AI response can tell me very little on its own.
A September 2026 study called “If I Had to Buy Just ONE: Galaxy S26 Ultra”: Auditing AI-Generated Product Recommendations collected 2,528 real commercial-advice queries and evaluated 1,536 product-query responses across ChatGPT, Gemini, their APIs, and Google AI Overviews.
The researchers found only 5.4% average source-domain overlap between the ChatGPT and Gemini consumer interfaces.
In 76.7% of the comparisons, the two systems did not share a single source domain.
They also found only 12% average domain overlap between ChatGPT’s API and consumer interface, and 14.8% between Gemini’s API and consumer interface. Recommended products could also change when the same request was repeated.
I don’t read that as “AI search is random.”
I read it as a warning against taking one screenshot too seriously.
If I run a prompt once and my brand appears, I have one observation.
If the brand keeps appearing across repeated runs, different questions, and different engines, I have something much more useful.
Keep the testing conditions too
I also store some basic context with every observation.
At minimum:
- Prompt
- Prompt category
- AI engine
- Consumer interface or API
- Date
- Run number
- Brand mentioned: yes/no
- Brand recommended: yes/no
- Owned domain cited: yes/no
- Cited domains
- Cited URLs
- Competitors mentioned
If the platform exposes a model, search mode, location, or other setting that could change the answer, I keep that too.
You usually don’t think you need this information until two tests give very different results.
Then you need it.
1. Brand Mention Rate
This is the easiest metric to understand.
Did the brand appear in the answer?
My formula is:
Brand Mention Rate = Observations containing the brand ÷ Eligible observations × 100
Suppose Northstar appears in 68 out of 100 observations.
Its Brand Mention Rate is: 68%
That tells me Northstar is entering the conversation quite often.
It does not tell me whether the system thinks Northstar is a good option.
For example:
Northstar is one of several tools available in this market, although larger enterprises may need more advanced controls.
I would count that as a brand mention.
I would not count it as a recommendation.
Mention Rate answers a fairly narrow question:
How often is the brand present?
That is enough.
I don’t need every metric to answer five questions at once.
If a company barely appears for the problems and use cases it wants to be associated with, I can start looking into things such as brand recognition, topical relevance, third-party mentions, category association, competitor strength, or missing content.
But first I need to know whether the brand appears at all.
2. Recommendation Rate
This is where the commercial side becomes more interesting.
A recommendation is stronger than a mention because the AI system is connecting the brand with the person’s actual need.
For example:
Northstar is a good option for smaller agencies because it supports external client access and workload planning.
I would count that as a recommendation.
This:
Northstar is another project-management platform.
I wouldn’t.
My formula is:
Recommendation Rate = Observations recommending the brand ÷ Recommendation-eligible observations × 100
The denominator is important here.
I would not calculate Recommendation Rate across every prompt.
Take this question:
What is project management software?
That is informational.
The answer does not need to recommend anybody.
Now compare it with:
What is the best project-management software for a 25-person design agency?
A recommendation makes sense there.
If I mix both types of prompts together, the final percentage becomes harder to read.
Suppose I have 60 recommendation-oriented observations and Northstar is recommended in 24.
The Recommendation Rate is:
24 ÷ 60 = 40%
Now I have a commercial visibility signal.
Northstar is being actively suggested in four out of ten relevant observations.
I can compare that with competitors.
I can break it down by use case.
I can check which engine recommends it most often.
I can also see where it gets mentioned but stops short of being recommended.
That gap can tell me quite a lot.
I also keep negative recommendations separate
A brand can appear in a buying answer without that appearance being good.
For example:
Northstar works well for small teams, but I would avoid it for large enterprises that need advanced governance.
The brand was mentioned.
Depending on the full answer, it may even be recommended for one audience.
But it is also being excluded from another use case.
A simple yes/no mention field misses that.
For important commercial prompts, I normally want another classification:
- Positive recommendation
- Neutral mention
- Negative recommendation
I wouldn’t put all three into one metric.
3. Citation Rate
This is where I separate brand visibility from source visibility.
A company can be recommended even when its own website is never cited.
That happens because AI systems can use information from somewhere else.
A review platform may describe the product.
A publisher may compare it.
A Reddit discussion may contain firsthand opinions.
A marketplace may provide features or pricing information.
The brand gets visibility.
The company website may have played little visible role in the answer.
So I track Citation Rate separately.
My formula is:
Citation Rate = Observations citing the owned domain ÷ Citation-eligible observations × 100
Suppose Northstar appears in 65% of relevant AI responses.
But northstar.com is cited in only 14%.
Now I have something worth investigating.
The brand clearly has some presence.
Its own website has much weaker source visibility.
I would want to know what is appearing instead.
Maybe G2 keeps getting cited.
Maybe Reddit is doing most of the work.
Maybe a competitor has better educational content.
Maybe industry publications explain the category more clearly.
Maybe the company gets recommended because of third-party reputation, while its own website barely contributes to the source layer.
That gives me a very different action plan from:
Our AI visibility is 65%.
OpenAI says ChatGPT search can return web-based answers with citations and links to sources. Users can also open the Sources area to see references behind a response.
Google explains that AI Mode can use a query fan-out process, where a question is divided into subtopics and searches are performed across multiple sources before the response is put together.
So I treat citation visibility as its own layer.
Mention Rate and Citation Rate can move in completely different directions
Imagine this:
Mention Rate: 70%
Citation Rate: 8%
That tells me the brand is well represented in answers, but the company’s own website is not often being used as a visible source.
Now flip it:
Mention Rate: 22%
Citation Rate: 48%
The company’s website is being used as information, but the brand itself is not entering the conversation very often.
Those are completely different situations.
I would not give both companies the same SEO plan.
4. Source Share
Citation Rate tells me how often my own domain appears.
Source Share tells me how much of the citation environment I actually own.
I calculate it at the domain level:
Owned Source Share = Owned-domain appearances ÷ Total cited-domain appearances × 100
I keep one rule consistent.
If one AI response links to three pages from the same domain, I count that domain once for that observation when calculating domain Source Share.
I still save the individual URLs separately.
I just don’t want one answer containing five links from the same website to make that domain look five times more influential.
Here is a fictional example.
Across the tracked answers:
Northstar appeared as a cited domain 24 times.
Competitor A appeared 31 times.
A review platform appeared 20 times.
A community website appeared 11 times.
Other websites accounted for another 34 appearances.
Total cited-domain appearances:
120
Northstar’s Owned Source Share:
24 ÷ 120 = 20%
Northstar owns one-fifth of the source environment I observed.
The next question is more useful than the number.
Who owns the other 80%?
If review platforms dominate, I start looking there.
If competitors dominate, I want to study the pages that keep getting cited.
If communities dominate, I want to see which conversations are being pulled into answers.
If publishers dominate, I want to know what information they provide that my site doesn’t.
This is where AI citation tracking becomes useful competitive research.
Instead of only asking:
Did we get cited?
I can ask:
Who is shaping the answer when we are not?
I find that question much more useful.
Source Share is not the same as brand Share of Voice
I keep these separate too.
Brand Share of Voice is about how much a brand appears compared with competitors.
Source Share is about which websites are supplying information.
A company could have strong brand visibility while most of the evidence comes from third-party websites.
Another company might own a lot of citations while rarely being recommended.
Again, I want to see both.
5. Prompt Coverage
Mention totals can hide concentration.
Imagine two brands.
Brand A gets 50 mentions.
Brand B gets 44.
Brand A looks stronger.
Then I check the actual prompts.
Brand A’s 50 mentions came mostly from five very similar questions.
Brand B appeared across 18 different customer questions.
Now the picture looks different.
Brand A is very strong in a narrow area.
Brand B has broader coverage.
That is why I use Prompt Coverage.
The formula is:
Prompt Coverage = Unique tracked prompts where the brand appears ÷ Total tracked prompts × 100
If I track 40 prompts and Northstar appears at least once for 26:
Prompt Coverage = 65%
I like looking at Mention Rate and Prompt Coverage together.
Mention Rate tells me how frequently the brand appears across observations.
Prompt Coverage tells me how widely that visibility is spread across the demand set.
A company can have a good Mention Rate and still have narrow coverage if most of its visibility comes from only a few prompt groups.
There is one limitation though.
If I run a prompt five times and the brand appears once, that prompt technically counts as covered.
That is why I also track consistency.
6. Repeat Consistency
This is probably the metric I care about most when I am trying to work out whether a result is real or just occasional.
Take one prompt.
Run it five times.
The results might look like this:
Brand mentioned: 4/5
Brand recommended: 2/5
Owned domain cited: 3/5
I find those raw numbers much easier to understand than a black-box “AI Stability Score.”
I know exactly what happened.
For an individual event, the formula is simple:
Repeat Consistency = Runs containing the event ÷ Total repeated runs × 100
So if Northstar appears in four of five runs:
Mention consistency = 80%
If it appears once:
Mention consistency = 20%
I treat those two results very differently.
The September 2026 commercial-advice study also found that products and displayed sources could change across repeated requests.
That is why one screenshot doesn’t tell me much.
Checking tells me what happened once.
Measurement tells me whether it keeps happening.
For Google AI Overviews, I also track whether the feature appeared
There is another useful metric for search features that do not appear on every query.
I call it:
AI Feature Trigger Rate
The formula is:
AI Feature Trigger Rate = Searches where the AI feature appeared ÷ Eligible searches tested × 100
Suppose I test 100 searches and an AI Overview appears for 42.
The trigger rate is:
42%
Then maybe my brand appears in 10 of those 42 AI Overviews.
Those are two separate facts.
One tells me how often the feature exists across my demand set.
The other tells me how often my brand appears when the feature is present.
I don’t want “AI feature didn’t trigger” and “AI feature triggered but my brand wasn’t there” treated as the same result.
Google’s documentation also notes that AI Overviews are only shown when Google’s systems determine they add something useful to traditional Search, so they do not trigger for every search.
Always show the numerator and denominator
This is a small reporting habit that makes AI visibility numbers much easier to trust.
Instead of writing:
Recommendation Rate: 40%
I would rather write:
Recommendation Rate: 40% (24/60 eligible observations)
Same percentage.
Far more context.
This becomes even more important when people compare month-over-month numbers.
If last month’s 40% came from 20 observations and this month’s 45% came from 400 different observations, saying visibility “increased 5 percentage points” can be misleading.
I want to know:
- Sample size
- Prompt set
- Engine
- Number of runs
- Observation period
- Eligibility rules
The percentage comes after that.
The gaps between the metrics are usually more useful than the metrics themselves
This is the part I enjoy analysing most.
Imagine two fictional companies.
Brand A
Mention Rate: 72%
Recommendation Rate: 48%
Citation Rate: 9%
Brand B
Mention Rate: 44%
Recommendation Rate: 21%
Citation Rate: 39%
Brand A has much stronger answer visibility.
It gets discussed and recommended regularly.
Its own website barely appears in the citations.
Brand B has almost the opposite situation.
Its website appears regularly as a source, but the brand itself is not being recommended at the same rate.
I would investigate Brand A by looking at the sources behind its recommendations.
Maybe review platforms already talk positively about it.
Maybe publishers cover the product well.
Maybe customers discuss it heavily in communities.
Maybe the company has good market awareness but poor owned-source visibility.
Then I would inspect its own content.
Are important product claims actually explained?
Is there enough first-party evidence?
Does the company publish useful comparison content?
Does it have good pages for its main use cases?
Is there original research, data, documentation, or customer proof that other sites don’t have?
Brand B gives me a different problem.
Its content is apparently useful enough to cite.
But that authority is not turning into recommendation visibility.
Maybe the product positioning is vague.
Maybe the educational content sits too far away from the product.
Maybe competitors make a clearer case for specific situations.
Maybe the site explains the category extremely well but never explains who the product is actually for.
These are not small differences.
One visibility score would hide most of them.
Measure every AI engine separately first
Another thing I would not do is test ChatGPT and then call the result “AI visibility.”
That is too broad.
The 2026 commercial-recommendation study found only 5.4% average source-domain overlap between the ChatGPT and Gemini consumer interfaces under the conditions the researchers tested.
Google also says AI Mode and AI Overviews may use different models and techniques, which means the responses and supporting links can vary.
Different AI systems are not giving me one shared source environment.
So I want engine-level reporting first.
For example:
- ChatGPT Mention Rate: 71%
- Gemini Mention Rate: 48%
- Google AI Mode Mention Rate: 39%
- Perplexity Mention Rate: 58%
If I report only an average of 54%, I lose the most useful observation.
Northstar performs well in ChatGPT.
It is much weaker in Google AI Mode.
Now I know where to look.
- Which prompts create the gap?
- Which competitors appear in Google AI Mode instead?
- Which sources are different?
- Does Google surface different types of websites?
Are our pages appearing in the source layer but the brand isn’t entering the generated answer?
That is the investigation.
I also keep APIs and consumer interfaces separate
This became much more obvious after the 2026 study.
The researchers found average source-domain overlap of only 12% between ChatGPT’s API and consumer interface, and 14.8% between Gemini’s API and consumer interface.
So if I use an API for large-scale tracking, I label it as API data.
I don’t automatically treat it as a perfect representation of what somebody sees in the normal ChatGPT or Gemini interface.
APIs are useful.
They make tracking much easier at scale.
But the measurement surface needs to be clear.
ChatGPT API visibility is one thing.
ChatGPT consumer-interface visibility is another.
If the goal is understanding what buyers actually encounter, I want at least some testing inside the real consumer product.
Bad prompts produce bad AI visibility reports
The formulas are not the hardest part.
The prompt set is.
I could calculate Mention Rate perfectly across 500 bad prompts and still end up with a useless report.
I don’t want a prompt list containing 40 small rewrites of the same keyword.
I want prompts representing different customer situations.
For a fictional analytics software category, I might track questions around:
Category discovery
What tools can help a company understand customer behaviour across its website and product?
Problem solving
How can a company combine CRM and product-usage data in one place?
Use case
What analytics software is suitable for a small B2B SaaS team?
Comparison
Product A vs Product B for attribution reporting?
Alternatives
What are good alternatives to Product C?
Recommendation
What are the best analytics tools for a team without dedicated data engineers?
Decision
Which analytics platform should I choose if fast implementation is my biggest concern?
Those questions represent different parts of a buying journey.
That is much more useful than generating hundreds of keyword variations and calling them prompts.
Keep branded and unbranded prompts separate
This is another easy way to accidentally make a brand look stronger than it is.
Compare:
Is Northstar Analytics good?
with:
What analytics platforms are good for a 50-person SaaS company?
Both are useful questions.
But the first one already contains the brand.
The system doesn’t need to discover Northstar.
The second prompt gives the brand nothing.
Northstar has to earn its way into the answer.
If half of my test set contains the company name, my overall visibility number can look great while unbranded discovery is actually weak.
I track both.
I just don’t mix them blindly.
Keep a benchmark prompt set
There is another reporting problem I see quite often.
A company runs 50 prompts in January.
Then it runs 70 different prompts in February.
Then somebody compares January visibility with February visibility.
That is not a clean comparison.
I prefer keeping two prompt sets.
Benchmark prompts
These stay mostly fixed.
I use them for month-over-month or quarter-over-quarter tracking.
Exploratory prompts
These can change.
I use them for new customer questions, new competitors, emerging categories, new products, sales conversations, community research, and other things I want to investigate.
If one exploratory question becomes important enough, I can add it to the next version of the benchmark.
I just document the change.
Otherwise, I can make visibility improve simply by changing what I measure.
Not every prompt has equal business value
There is another layer I add after the raw numbers.
Commercial importance.
A broad educational question and a product-selection question do not mean the same thing to the business.
For example:
What is marketing attribution?
is very different from:
Which attribution platform should a 50-person SaaS company choose?
Both may matter.
The second sits much closer to a buying decision.
I still keep the base metrics unweighted.
Mention Rate should remain Mention Rate.
Citation Rate should remain Citation Rate.
Then I can apply business context separately.
A basic model might be:
High commercial relevance = 3
Medium commercial relevance = 2
Low commercial relevance = 1
Those weights are not some industry standard.
They are just a transparent way of saying that not every question has the same commercial value.
If I create a business-weighted AI visibility metric, anyone looking at the report should be able to understand exactly how I calculated it.
No mystery score.
My rule is simple:
Raw measurement first. Business interpretation second.
Use Google’s first-party AI visibility data too
Prompt tracking should not be the only source of AI visibility data.
Google introduced dedicated Search Generative AI performance reports in Search Console in June 2026, and Google says the reports had been rolled out to websites worldwide by August 31, 2026.
The Generative AI performance report can show things such as:
- Generative AI impressions
- Pages that appeared
- Countries
- Devices
- Performance over time
It covers visibility inside Google’s generative AI Search features, including AI Overviews and AI Mode.
I would absolutely use that data.
But I would not replace prompt tracking with it.
They answer different questions.
Search Console can tell me that URLs from my site appeared in Google’s generative AI features.
My observation tracking can tell me:
- What question I asked
- Whether the brand appeared
- Whether the brand was recommended
- Which competitors appeared
- Which third-party sources were cited
- Whether the answer changed across repeated runs
One is first-party platform data.
The other is controlled observation.
I want both.
A full example
Let’s put everything together.
Northstar is a fictional B2B software company.
I track:
20 prompts
across:
4 AI engines
with:
5 runs per prompt
That gives me:
20 × 4 × 5 = 400 observations
After collecting and classifying everything, I get:
Brand Mention Rate: 54% (216/400)
Recommendation Rate: 31% (62/200 recommendation-eligible observations)
Citation Rate: 17% (68/400 citation-eligible observations)
Prompt Coverage: 65% (13/20 prompts)
Owned Source Share: 11%
Then I break Mention Rate down by engine:
ChatGPT: 71%
Gemini: 48%
Google AI Mode: 39%
Perplexity: 58%
I would not look at that and say:
Northstar has 54% AI visibility.
That throws away too much information.
What I actually see is this.
Northstar already has decent brand presence.
ChatGPT surfaces it much more often than Google AI Mode.
The brand gets mentioned much more often than it gets recommended.
Its own website gets cited far less often than the brand gets mentioned.
And northstar.com owns only 11% of the source environment we observed.
Now I have questions worth spending time on.
Why does ChatGPT surface Northstar more often?
Which prompt groups fail in Google AI Mode?
Which competitors are recommended when Northstar only gets mentioned?
Which websites own most of the other 89% of Source Share?
Is Northstar being recommended because of information on other websites rather than information from its own?
Does Northstar’s educational content get cited while its commercial pages rarely influence recommendations?
Are there specific use cases where visibility disappears?
That is useful analysis.
Whether a dashboard says 54 or 57 isn’t nearly as interesting.
Source Share can tell me where the SEO work should happen
I would also classify the cited domains.
For most projects, I want buckets such as:
- Owned website
- Competitors
- Review platforms
- Publishers and media
- Communities and forums
- Marketplaces
- Research and academic sources
- Government or official sources
The source mix can change what I do next.
Imagine review platforms account for 35% of Source Share across high-intent prompts.
The company website owns 12%.
Competitors collectively own 18%.
Publishing another generic blog article might not be the first thing I do.
I would look at the review platforms first.
- Which ones keep appearing?
- What information do they provide?
- Are the company profiles complete?
- Are the reviews current?
- Which features and use cases are reviewers talking about?
- Which comparison publishers keep influencing the answers?
Now imagine the opposite.
The company’s technical documentation is cited everywhere, but the brand rarely gets recommended.
That points toward another problem.
Maybe the information is good.
Maybe the product positioning isn’t.
Maybe the company explains the topic well but never makes a clear case for where the product fits.
Maybe competitors have stronger third-party proof.
Maybe customers use completely different language when describing their needs.
Source Share is useful because it helps me see who is influencing the answers around the questions buyers are asking.
Why I’m cautious with one AI Visibility Score
I understand why tools create one score.
It makes dashboards easy.
Clients understand 72/100.
Executives can compare this month with last month.
I just don’t want the score hiding the actual situation.
One company might have:
- High Mention Rate
- High Recommendation Rate
- Low Citation Rate
Another might have:
- Low Mention Rate
- Low Recommendation Rate
- High Citation Rate
A scoring formula could give both companies the same final number.
Their problems are completely different.
If I use an AI Visibility Score at all, I want the raw numbers sitting beside it.
I also want the methodology written down.
Whenever somebody says:
AI visibility increased 40%.
my next questions are:
- What prompts were tested?
- Were they the same prompts as last month?
- How many observations were used?
- Which AI engines were included?
- How many runs?
- Were branded prompts mixed in?
- Was the consumer interface tested or an API?
- What counted as a recommendation?
- How were citations counted?
- Did the testing conditions change?
- When was the data collected?
Without those details, the percentage can sound much more precise than the testing really was.
AI visibility is still not the business result
There is one final thing I don’t want to lose in all this measurement.
An AI mention is not revenue.
A citation is not a lead.
A recommendation is not a closed deal.
These metrics describe what is happening during discovery and evaluation.
The business result comes later.
The way I think about it is:
Customer demand → AI visibility → Mention / Recommendation / Citation → Brand exposure or visit → Evaluation → Conversion
Sometimes the person clicks through.
Sometimes they keep asking questions inside the AI interface.
Sometimes they remember the brand and search for it a week later.
Sometimes they visit through another channel.
Sometimes nothing happens.
So I would never replace normal business measurement with AI visibility metrics.
I would use them alongside:
- Google Search Console
- Google’s Generative AI performance reporting
- Analytics
- AI referral traffic
- Branded search demand
- Lead data
- Demo requests
- Conversions
- Pipeline
- Revenue, where attribution is realistic
The AI metrics show what is happening during discovery.
The business metrics show whether any of it turns into something useful.
The AI Search Visibility framework I use
If I were building AI visibility tracking from zero, this is how I would set it up.
1. Define the demand
Start with customer questions worth tracking.
I want problems, use cases, category questions, comparisons, alternatives, recommendations, objections, and decision-stage prompts.
I keep branded and unbranded demand separate.
I also keep a stable benchmark prompt set for trend tracking.
2. Define the observation
My base rule is:
One prompt × one engine × one run = one observation
I document the engine, date, surface, run number, and other testing conditions that could affect the result.
3. Collect repeated observations
Important prompts get repeated.
I don’t assume one response represents the whole platform.
The more important the prompt is to the business, the more interested I am in whether the result repeats.
4. Classify what happened
For every observation, I record the events separately:
- Mention
- Recommendation
- Citation
I also store competitors, cited domains, cited URLs, prompt type, and any other useful context.
5. Measure source influence
I calculate Citation Rate and Source Share.
Then I look at which competitors, publishers, review sites, communities, and other sources appear repeatedly.
This is often where the most interesting competitive information comes from.
6. Measure breadth and consistency
I look at Prompt Coverage.
I compare repeated runs.
I compare engines.
I look for places where visibility is strong but narrow, broad but inconsistent, or heavily dependent on one AI system.
7. Add business context
Only after I have the raw numbers do I add commercial importance.
Then I compare AI visibility with first-party platform data, branded demand, traffic, conversions, leads, pipeline, and revenue where the data supports it.
The whole system looks something like this:
Define Demand → Define Observations → Collect Runs → Classify Visibility → Measure Source Influence → Measure Consistency → Connect to Business Value
None of the formulas are especially complicated.
Most of the work is being disciplined about what each number actually means.
If somebody asks why a brand has a 54% Mention Rate, I should be able to show the observations behind it.
If somebody asks why Source Share is 11%, I should be able to show exactly which domains were counted.
If ChatGPT visibility is much stronger than Gemini visibility, I should be able to show which questions created the gap.
If Recommendation Rate suddenly jumps next month, I should know whether the brand really improved or somebody simply changed the prompt set.
That is what I want from AI search visibility measurement.
A report that helps me understand what is actually happening.
- Where the brand appears.
- Where it gets recommended.
- Where its own information gets used.
- Who influences the answers when the brand doesn’t.
And where I should investigate next.
Not another number to put on a slide.